


Forest Regeneration
Back to the Monitoring Hub
Increase abundance and regeneration rate of key tree species
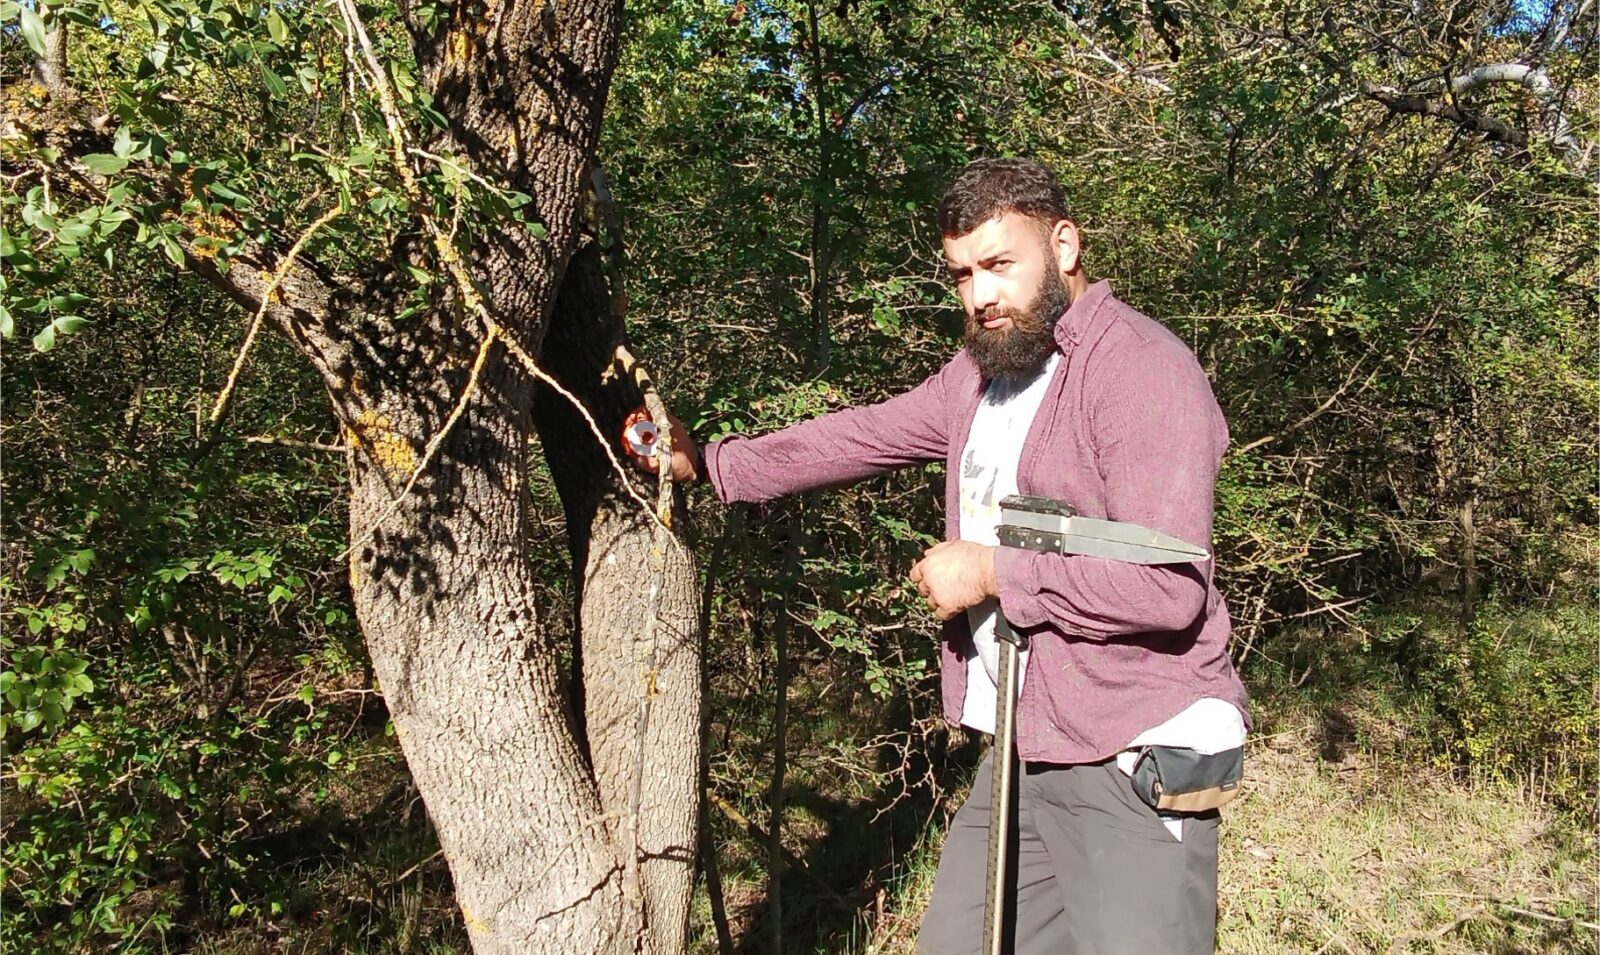
Data collection in progress
Kakheti Steppes
Georgia
Problem: Since the construction of the Dali dam, the floodplain forest downstream of the dam has been drying out, resulting in a loss of native floodplain forest tree species and a reduction in the condition and extent of the forest.
Action: SABUKO is working with the dam managers to recreate flooding events by periodically releasing water from the Dali dam. They have also constructed one gabion and are building more downstream of the dam, to retain water in the floodplain area when water is released.
Indicator: The success of this restoration treatment is being monitored by estimating the abundance of seedlings and saplings regenerating since the application of flooding events began.
Methods
This monitoring work is a continuation from the Iori River Valley project, which has been monitoring seedling and sapling abundance in the floodplain forest area since 2019. Fifty circular plots (25 plots in the control area and 25 in the treatment area), each spanning an area of 500 m², were established to systematically record the occurrences of seedlings and saplings within them. Two sub-plots were established in each plot (one north of the plot centre, one south), with radii of 1.5m. Within the sub-plots, all seedlings and saplings (< 8cm in diameter) were recorded, and total number of seedlings/saplings added together from the two subplots was the final variable per plot. Data collection occurred in 2019 and 2021, enabling the evaluation of changes over time since period flooding events began in 2020.
In 2023, the number of sampling plots was increased to 151, and regenerating abundance was documented using the previous methodology. Fifty-four plots were located in the treatment area (below the dam), while 97 plots were established in the control area (above the dam). A subset of these plots are the fifty plots from the Iori River Valley project (25 above the dam, 25 below). The same plots were also used to monitor forest condition.
Results
The mean number of saplings per plot differed significantly between years (F(2,2527) = 22.4, p < 0.001, Fig. 1), with fewest saplings per plot measured in 2023 and most in 2021. There was no significant difference between the control and treatment plots.
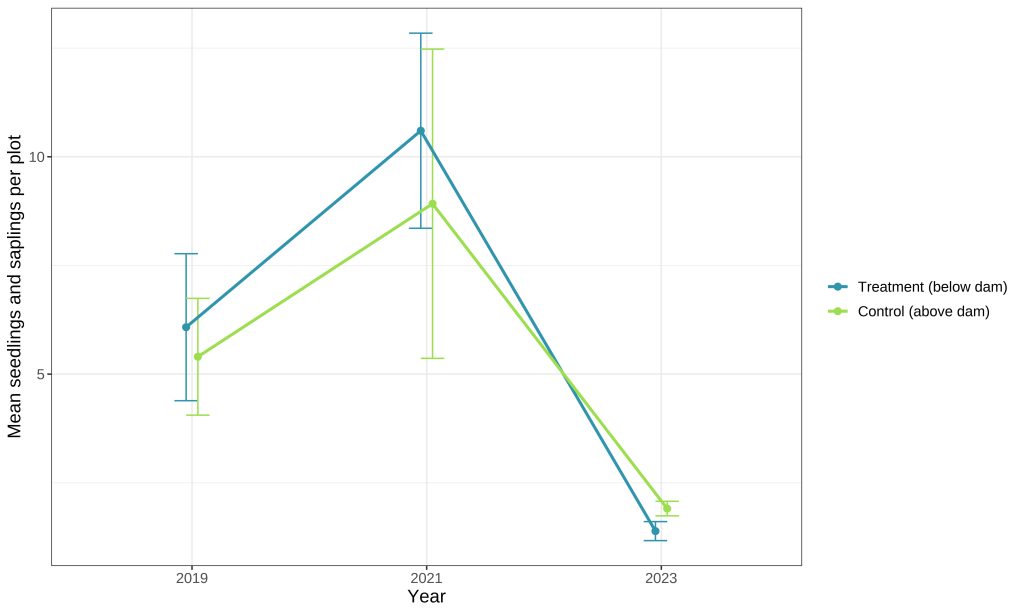
Figure 1: Mean number of seedlings and saplings (<8cm diameter) per sampling plot, in treatment and control sites. Error bars denote standard error of the mean (SEM).
Partners


